
Have you ever noticed how some operations navigate critical periods with predictability, while others operate in emergency mode?
In practice, the difference isn’t necessarily about having a larger team or a bigger budget. It appears in the maturity of maintenance management: what questions are asked, what data supports the answers, and how decisions are prioritized.
Maintenance indicators are essential, but they alone are not enough. What changes the game is the ability to transform numbers into action.
Whether in agricultural fleets, mining, or industry, understanding maintenance KPIs and questioning things as they are helps move from a reactive approach to a model anchored in the actual condition of the asset.
Maintenance indicators: 10 strategic questions to increase reliability and predictability in maintenance management
1. Will my equipment hold up until the end of the critical period?
Every operation has its moment of truth:
- In agribusiness, it’s the harvest season
- In mining, it’s the period of intensive production
- In industry, it’s the months of high demand
- In energy, it’s the peak periods of extreme consumption
A combine harvester that stops working at the peak of the harvest can cost between US$1,000 and US$3,000 per day. That doesn’t include emergency repairs, which are 3 to 5 times more expensive.¹
In mining, an inoperable off-road truck can mean US$10,000 in lost opportunity every day.²
The problem? Some maintenance managers respond with hope, not data:
- “I think so”
- “It should hold up”
- “It’s never failed before at this time of year”
More mature operations respond differently.
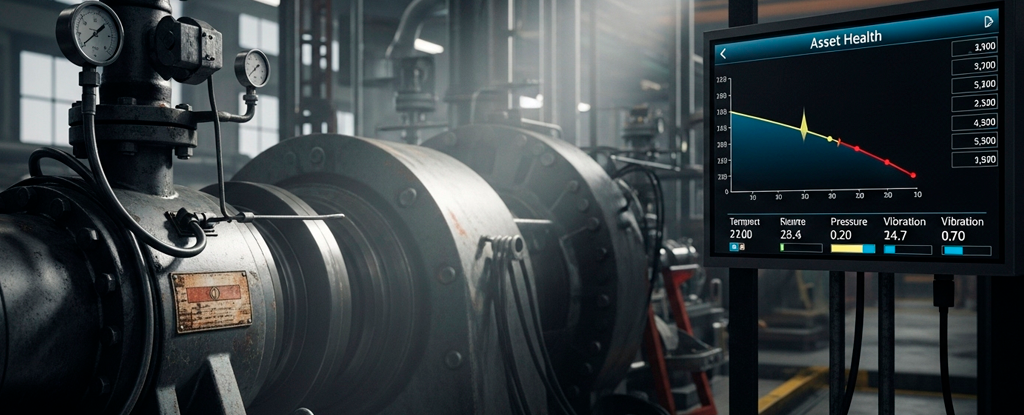
They consult maintenance performance indicators and predictive analytics. When the data says “this equipment has a 65% probability of failure”³, they act before the statistics.
The difference between waiting and knowing lies in tools like oil analysis and thermography.
2. Why is this failure happening for the third time?
Do you have a piece of equipment in your operation that is a frequent maintenance customer? The kind that returns to the workshop every 2-3 months with the same problem?
Recurring failures indicate that the root cause has been ignored. Your maintenance KPIs likely track the recurrence rate, but are you acting on them? Treating symptoms is cheap in the short term, but extremely expensive in long-term maintenance management.
Each repetition multiplies the waste:
- Repair cost multiplied by two, three, five times
- Frustration of the team having to redo the same work
- Lost credibility when you explain, yet again, why that critical asset is out of service

3. I’m prioritizing what screams out or what matters?
The paradox of urgency means that noisy equipment consumes disproportionate attention.
Meanwhile, Class A assets (critical to revenue) operate at risk because they have never complained.
A mature maintenance management system classifies assets by real criticality: impact on production, cost per hour of downtime, and safety risks.
If you spend 60% of your time on secondary assets⁴, your prioritization is reversed. Focus predictive monitoring where the loss will be greatest.

4. Am I generating data or making decisions?
Industry 4.0 has brought about an explosion of data. IoT sensors, CMMS systems, monitoring platforms: everything generates information 24/7.
The problem?
Many operations are drowning in data, but thirsty for insights that lead to action.
They have:
- 50-page reports that nobody reads
- Dashboards with 30 maintenance indicators that nobody can prioritize
- Thousands of data points collected
- Critical decisions still made based on intuition
The question isn’t “how much data do I have?”, but “which maintenance indicators are guiding my decisions?”. Platforms like S360 transform raw data into prioritized recommendations.

5. How long does it take me to react toa critical failure?
Response speed exponentially amplifies or contains losses.
The mathematics of time:
- 0-4 hours: You contain the problem
- 4-24 hours: Secondary damage begins, costs triple ⁵
- 24+ hours: Cascade effect, costs increase 5 to 10 times⁵, safety risks arise
Your maintenance metrics likely include MTTR (mean time to repair). But have you analyzed where that time is being wasted?
It is generally not during the repair process.
It’s time until:
- Detect the fault
- Communicate with the right team
- Diagnose the cause
- Locate parts
- Mobilize resources
More mature operations tend to have:
- Automated alerts integrated with CMMS
- Strategic inventory of critical parts
- Standardized diagnostic procedures
- Rapid response teams with the authority to act without bureaucracy
The faster you react, the less damage there is. In practice, response time reduces impact.

6. Does my team put out fires or prevent fires?
The ratio between reactive and proactive maintenance is the most honest indicator of the maturity of your maintenance management.
The vicious cycle of reactive operations:
There’s no time for preventative maintenance because there are too many emergencies → There are too many emergencies because there’s no preventative maintenance.
Result: Teams work longer hours, morale plummets, costs skyrocket.
Maturity reference:
- Immature: 70% corrective, 25% preventive, 5% predictive ⁶
- Mature: 15% corrective, 35% preventive, 50% predictive ⁶
But be careful: Excessive preventive maintenance can also be a waste.
Changing the oil every 250 hours as a precaution when analyses show it could last 400 hours is a waste of money.
The ideal? Condition-based maintenance. You intervene at the right time, neither before (waste) nor after (risk).
That’s where oil analysis shines. Instead of changing fluids based on time or hour meter readings, you change them when the data indicates it’s time.
Result: Optimized intervals, fewer stops, controlled costs.
7. I knowthe true cost of each asset?
Most managers know the acquisition cost. Few know the TCO (Total Cost of Ownership).
A piece of equipment that is cheaper to buy may be the most expensive over its useful life.
TCO includes:
- Acquisition cost
- Accumulated maintenance (parts + labor)
- Downtime costs (lost production)
- Energy/fuel
- Depreciation
Real example:
Two forklifts in the same warehouse:
Equipment A:
- Initial cost: US$ 36.000
- TCO in 5 years: US$ 56.000
Equipment B:
- Initial cost: US$ 30.000
- TCO in 5 years: US$ 70.000
The cheapest one cost US$ 14.000 more over time.⁷
When you cross-reference maintenance indicators with downtime and repair costs, it becomes easy to prove to management which asset is draining the budget.

8. Am I measuring what the board wants to see?
Classic maintenance KPIs (MTBF, MTTR, OEE, availability) are important. But finance directors aren’t impressed by “we improved MTBF by 15%”.
They want to know:
- How much did this generate in savings?
- How much did it increase production?
- What was the return on investment?
The art of translation:
Technical language:
” We reduced conveyor failures in 40%”
Business language:
” We avoided 120 hours of downtime, generating an additional US$480,000 in production and reducing contractual penalties by US$160,000″⁸
When you connect maintenance performance indicators to tangible financial results, the conversation with management changes, and the investment becomes objectively justified.
Because you stop being a cost center and start generating value.
9. Is my team prepared for the future?
Maintenance is becoming technological. Does your team master the interpretation of reports and the use of digital platforms?
The skills gap is an invisible bottleneck in maintenance management.
Essential skills:
Traditional (still critical):
- Mechanical, electrical, and hydraulic systems
- Interpretation of technical manuals
- Use of diagnostic tools
Emerging (increasingly critical):
- Data analysis and interpretation
- Use of digital platforms (CMMS, predictive systems)
- Understanding of tribology and fluid analysis
- Project management and continuous improvement
Invest in training. Platforms like MundoALS offer courses for maintenance teams to improve their skills.

10. Do I know what I don’t know?
The most important question is about awareness of one’s own blind spots.
The greatest risks don’t come from what you know is wrong. They come from what you assume is right without validating it.
“We’ve always done it this way” is the most expensive phrase in the industry. Managers seek external validation and frequently challenge their own maintenance performance indicators.
Complacency is silent, but costly.
From reflection to action
Asking the right questions is the first step. The second is answering them with clear criteria: asset criticality, failure history, current condition, and operational and financial impact. The third is turning this into routine: monitoring, prioritizing, and acting before the risk turns into a shutdown.
In maintenance, reliability is not a discourse, it’s a system. And this system usually combines:
- Predictive and condition-based monitoring (such as oil analysis, vibration, and thermography, when applicable)
- Data integration to provide context and prioritization
- Actionable alerts and recommendations, connected to the team’s routine
- Continuous training so that the team interprets signals and makes consistent decisions
If you want to apply these questions to your reality, ALS can support you in diagnosis and plan structuring, from monitoring to the process, focusing on predictability and risk reduction during the critical period.
Want to discuss your situation and most critical assets? Talk to a specialist ALS.
Notes and references
¹ Estimate of opportunity cost in the global agricultural sector. Values vary according to the size of the operation, region, and crop cultivated.
² Emergency repairs typically cost 3 to 5 times more than planned maintenance due to premiums for urgent parts and downtime costs.
³ Estimate for medium and large-scale global mining operations. Values vary according to the type of operation and commodity mined.
⁴ Illustrative example of predictive analysis. Probabilities vary according to equipment and monitoring program implemented.
⁵ Estimate based on global studies of resource allocation in operations with immature maintenance management.
⁶ Estimate of response time impact based on international benchmarks. Costs increase exponentially with delayed reaction.
⁷ Maturity benchmarks based on international frameworks such as RCM (Reliability Centered Maintenance). Proportions vary by sector and region.
⁸ Illustrative example of TCO. Actual values vary according to equipment type, region, and maintenance practices. ⁹ Illustrative example of technical translation into business language. Prices vary by type of operation and region.