• Portuguese (Brazil)
  • Spanish
MarcaMundoALS-bco-01
  • About ALS
  • Tutorial S360
✕
  • About ALS
  • Tutorial S360
✕
MarcaMundoALS
  • About ALS
  • Tutorial S360
✕
  • About ALS
  • Tutorial S360
✕
360: Technology that generates efficiency in maintenance
3 de June de 2025
Frequência de coleta ideal
Ideal Sampling Rate
3 de September de 2025

Cause and Effect Table

Published by Ana Alberti on 4 de June de 2025
Categories
  • Articles
Tags
  • Analysis

Learn about the main cause and effect relations of breakdowns or possible reasons for changes in ALS analysis results.

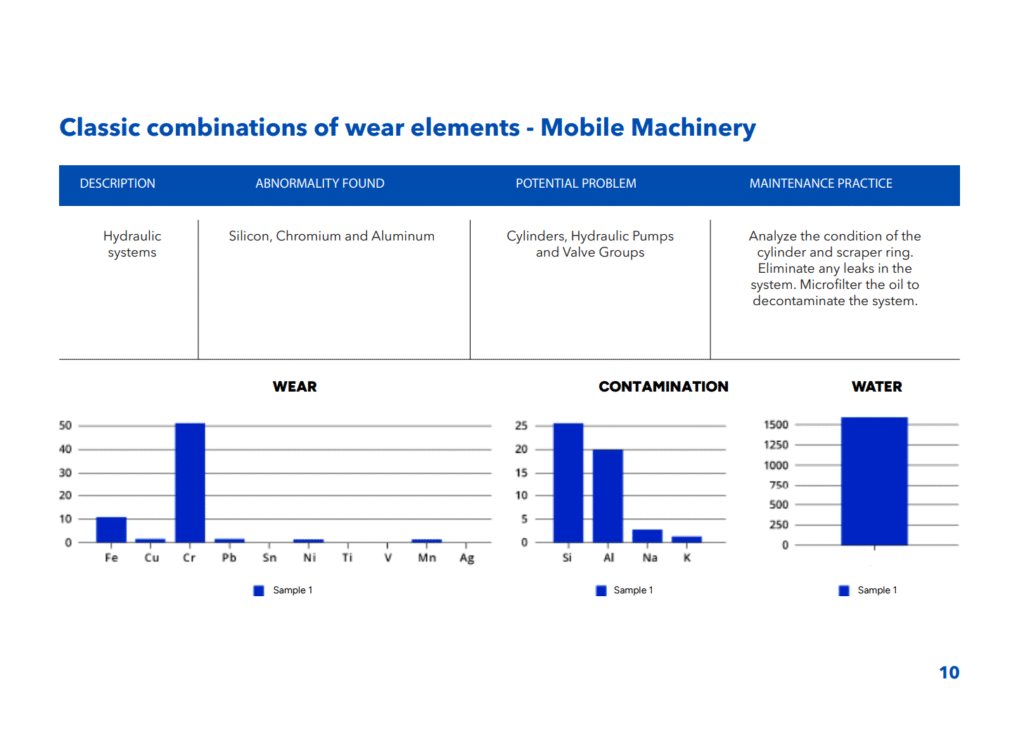
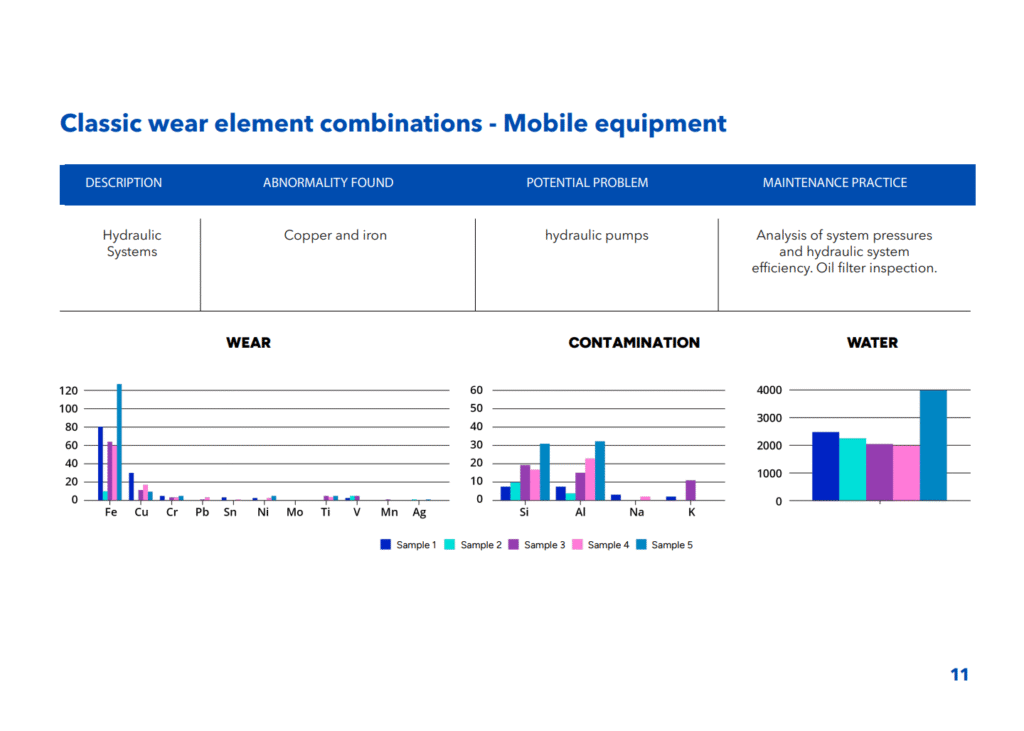
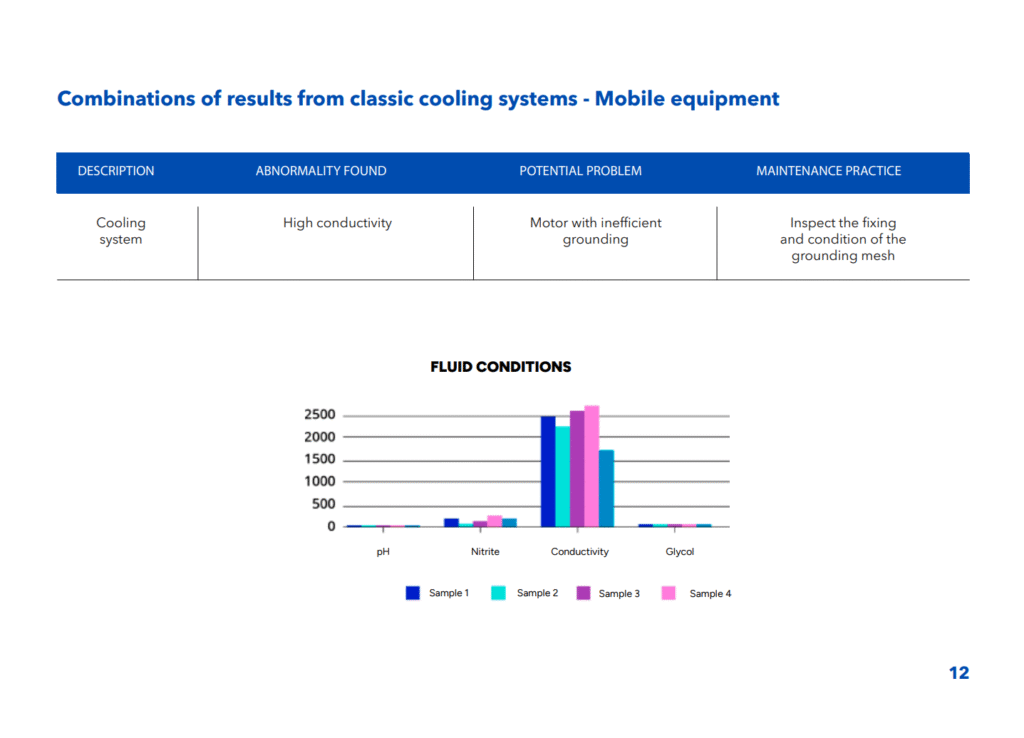
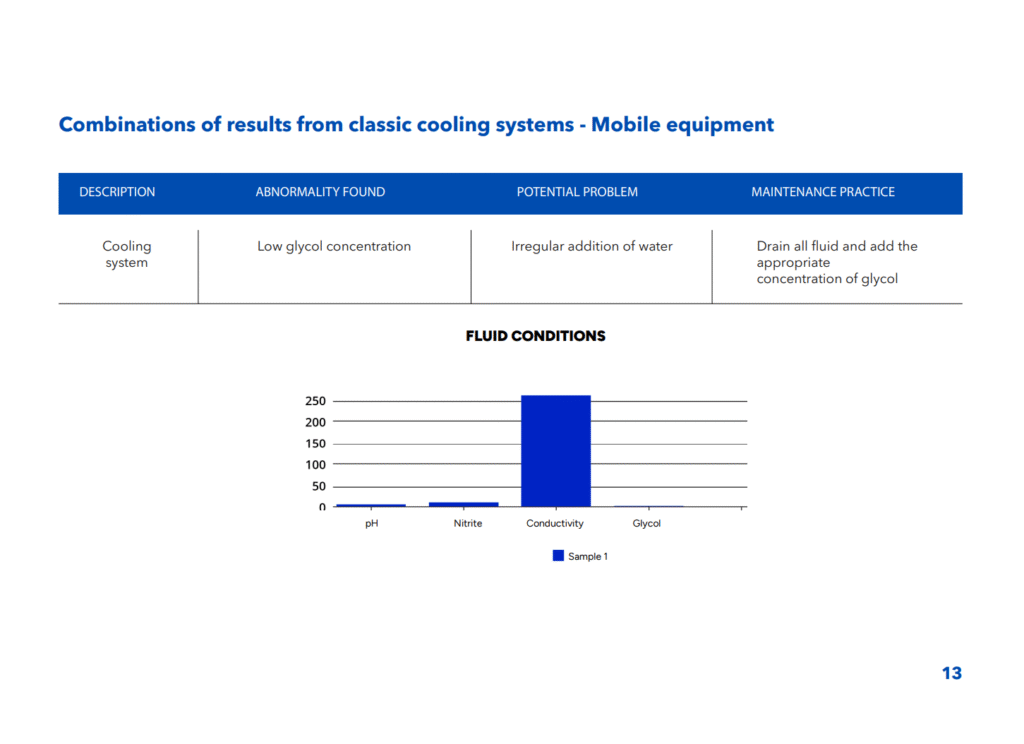
Do you have any questions about cause and effect relationships in analysis? Contact our customer support team!

Compartilhe:

Related posts

Frequência de coleta ideal
3 de September de 2025

Ideal Sampling Rate


Read more
3 de June de 2025

360: Technology that generates efficiency in maintenance


Read more

A Close up of golden oil splashing from bottle with faint economy graph in background, symbolizing energy markets and financial trends

19 de May de 2025

ALS fluid analysis tests


Read more
  • Português (Portuguese (Brazil))
  • Español (Spanish)
  • English

Quality policy | Quality Policy | Quality Policy © MundoALS - 2023

✕

Login

Lost your password?

  • Português (Portuguese (Brazil))
  • Español (Spanish)
  • English